Number of the Day Template with @CoriOrlando1
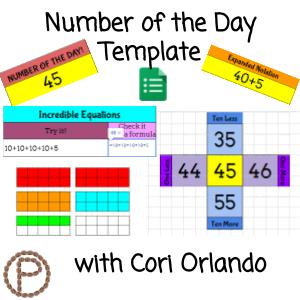
Recently, my buddy Cori Orlando, hit me up with an idea about a Number of the Day activity, where kids represent a number in different ways. She visualizes the activity being something the kids can do in class regularly. We put our heads together and designed a spreadsheet activity together. Continue Reading →