The Next Generation Science Standards calls for my kiddos to make observations and find patterns about what plants and animals need to survive (K-LS1-1). I referred to a PDF of the evidence statements for this particular standard while designing for this unit. One branch to this unit led to the kids finding patterns among different animals. Over several days the kids worked on activities involving:
- selecting an animal to learn more about
- taking notes about the animals by listening to videos
- collaborating in small groups to share the facts they acquired and contributing to a checklist chart
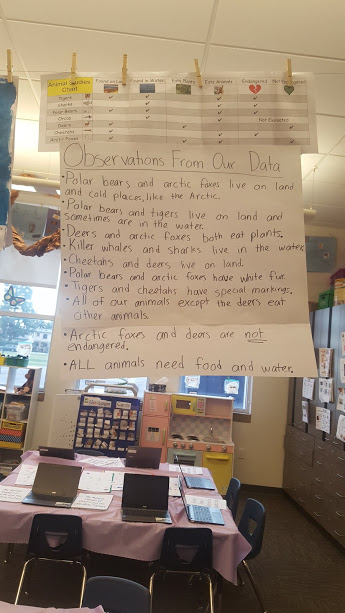
- making interpretations as a whole class about the data collected in the chart
- painting a picture of the animal, its habitat, and what it eats
What animals do the KIDS want to study?
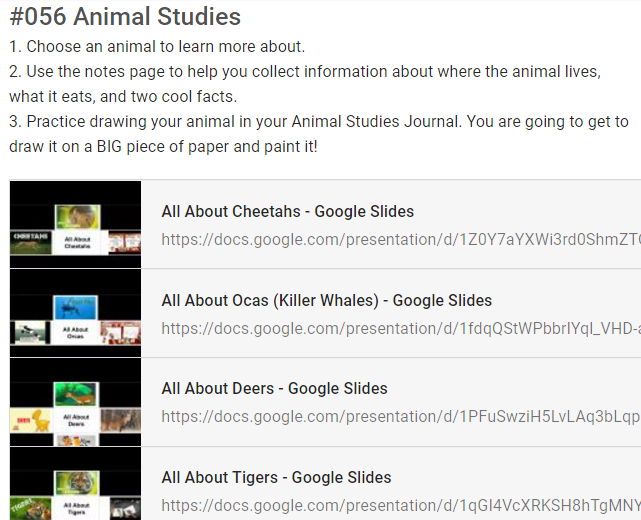
I could have easily guessed which animals they would have liked to study, however, I surveyed the kids’ interests so they knew they had a voice in what they chose to study. The top voted animals were selected and I did some behind the scenes work of collecting some sources my kiddos could use. For each animal, I created a Google Slides presentation with two videos for the kids to collect facts from and a guided drawing video. The slides are hyperlinked, and the kids were instructed to click on the images of the videos so they could learn more. To go back to the “home slide” kids click on the house image.
Kids Access Slides in Google Classroom
I created slides for tigers, sharks, polar bears, orcas, deers, cheetahs, and arctic foxes. HERE is the folder in my Drive where you can view the slides. In the notes sections of the slides, I took notes in the notes section about the content in the videos. You can take these links and add them as LINKS directly to your Google Classroom assignment. Since the links are on published mode for the slides, when the kids click on the link(s) in Classroom, it will automatically put it on presenter mode. (Presenter mode is when you do not see the interface of Google Slides, such as the filmstrip and toolbar.)
Strange and Important Side Note
I found that if you are the owner of the slides or the slides are shared with you, the published link in Google Classroom will NOT post on published mode. My guess is that Classroom recognizes that you are the owner/have editing rights, and boots the link back to a view only file for students. You are good to go with the published links of the slides I provided you (see paragraph above), but this is important to know if you are creating slides from scratch and trying to post them on Classroom with published links. If you do create the slides from scratch, post them as “can view: docs and have the kids click on the “Present” button upon opening. The kids can also just go through the slides. It might actually be easier and less work for you this way. 🙂
Kids Take Notes
Before I let the kids do this on our own, we studied an animal as a whole class. They got a preview of what they were going to be doing independently. We talked about the notes page and what things they were going to need to listen for (where does the animal live, eat, and two cool facts about it).
Click here to get a copy of the notes page below.
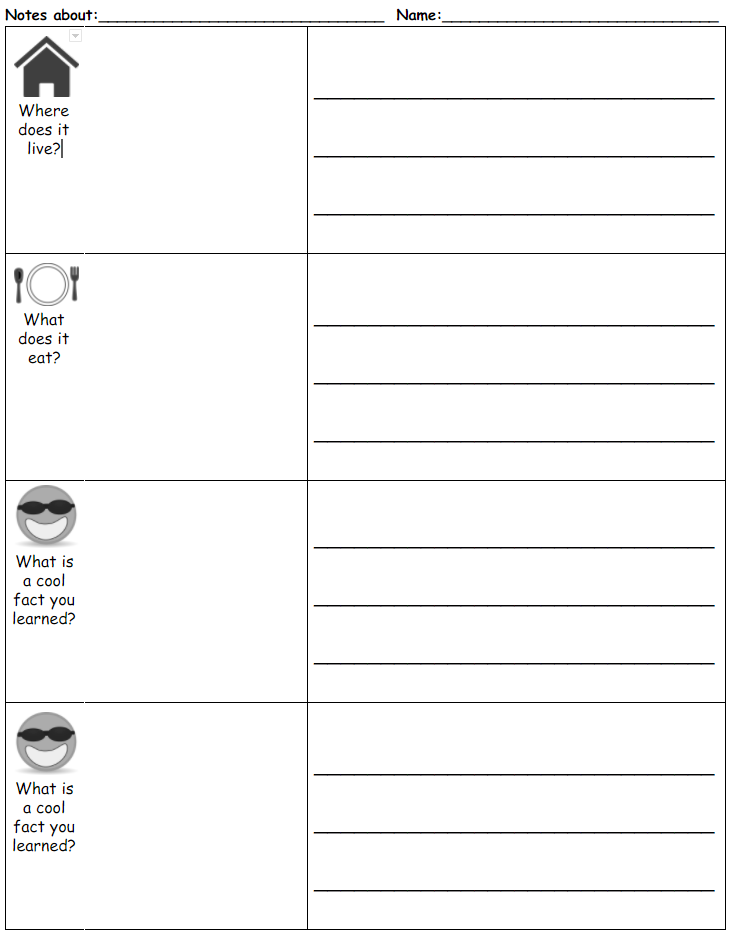
Whole Class Note Taking Observations
I told the kids, when you hear a fact that we need, raise your hand and I’ll pause the video. The kids did just that. We talked about how sometimes you might miss the information and have to go back, and how to do that. They shared orally about what the factual information they heard. Then they were instructed to draw a picture for the fact and write a sentence that supported that fact. Sharing aloud, or brainstorming, helped the kids hear each other’s ideas. Additionally, it helped the “processing” of information. Before the kids even put a pencil to the paper they got to think and visualize their ideas. Without calling kids out, I shared my observations aloud of what I was seeing: capital letters at the start of sentences, periods at the end of sentences, neat writing, and effort with spelling. It was my way of reminding them of what I was expecting out of them.
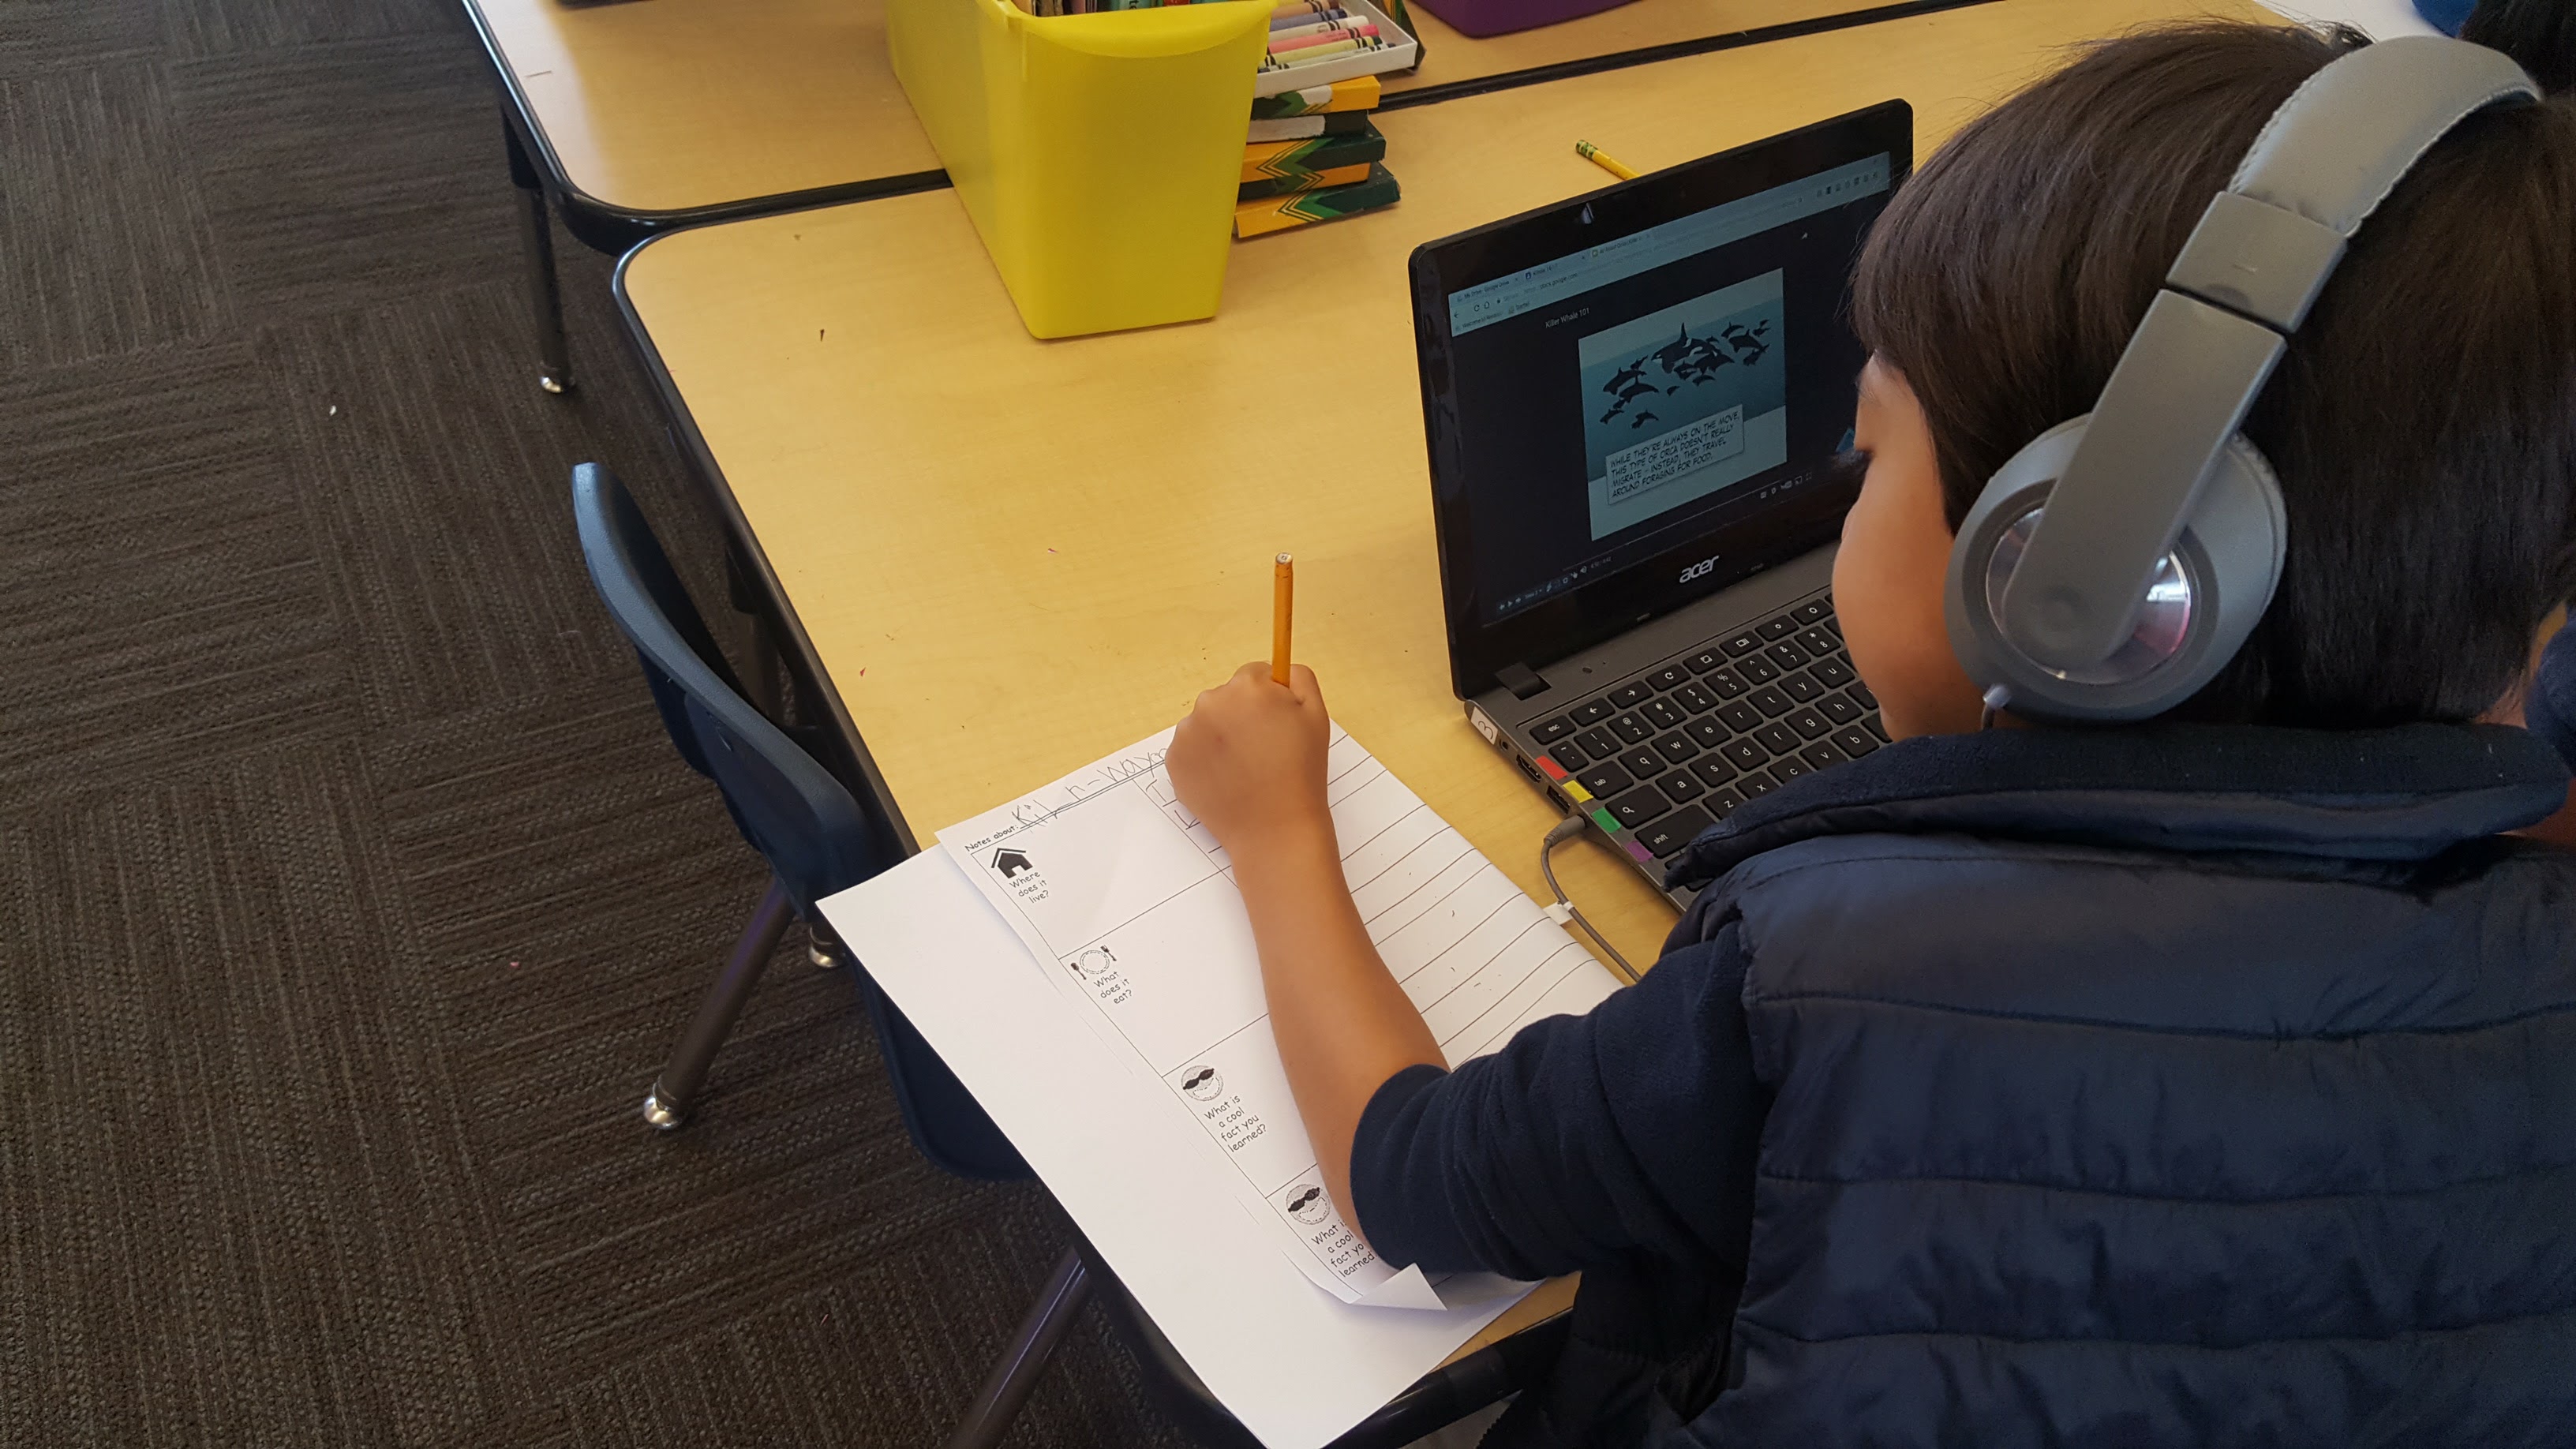
Independent Note Taking Observations
I was very pleased the day the kids were working independently on taking notes about their animals. To recap, they chose from a list of the top voted animals in Google Classroom, and used the hyperlinked slides to access the factual videos. All of my kids were working on the same activity at the same time, but were studying an animal of choice. What I really loved about this activity, was that it gave me individual time with kids. I had the opportunity to hop to different kids and discuss what they were learning about and coach with writing conventions and sounding out words.
Meet, Collaborate, and Chart
I called each group together who studied the same animal. They shared out their findings aloud with each other.
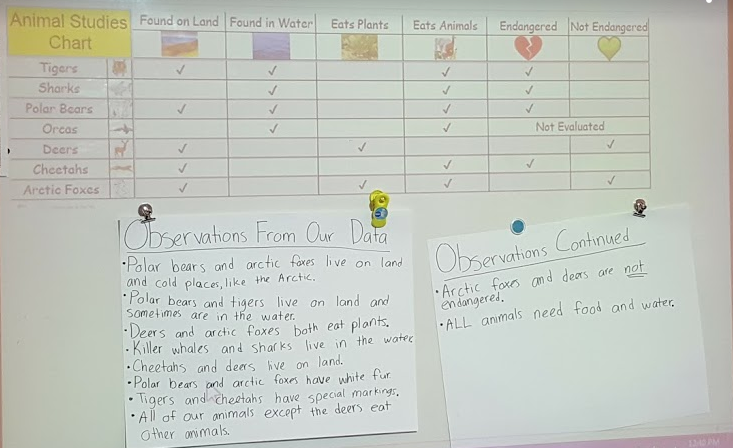
Click here for a copy of the Animal Studies Chart

To get a whole table view of the spreadsheet, you can use CTRL and – to zoom out and CTRL and 0 to reset the view. The spreadsheet with the chart has three sheets.
- Class Collaboration Sheet – This is where the kids put the check marks for the animal their group studied
- Check Mark Sheet – This is where the kids get the check mark from.
- Answer Sheet – This is for your reference.
Whole Class Animal Chart Discussion
The next step was to bring all the kids together to interpret the data on the chart and discuss patterns they saw between the animals.
Paint Your Animal and Type Your Facts
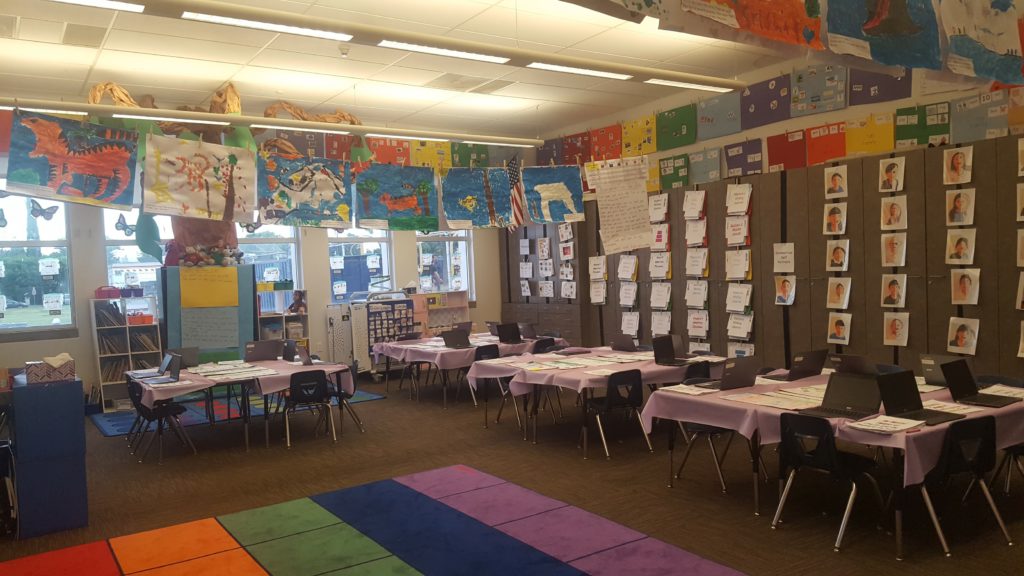
The kids were going to be sharing about the animals that they studied for open house, so they went a the extra mile to make things extra fancy. The kids painted their animals and typed up their facts for a clean and polished finish! Each animal had a guided drawing video. Most of the videos were from THE super awesome Rob from Art For Kids Hub. I gave the kids the biggest white piece of paper I had access to (18×24) and let them draw! I told them they needed to include the habitat where the animal mostly lived and include something the animal would eat.
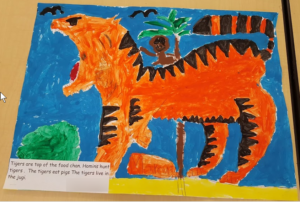
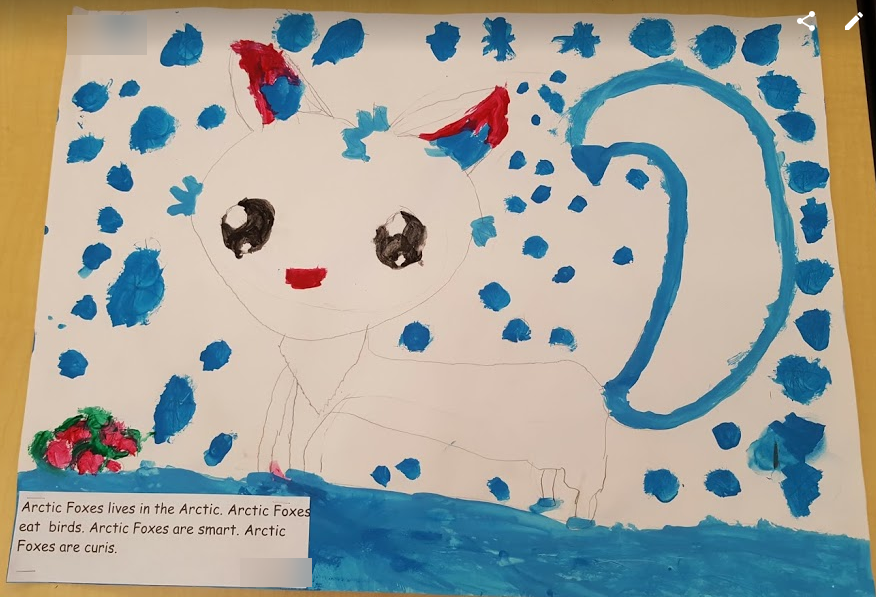
The paintings hung nicely in the middle of our room. Even the data chart had it’s place 🙂
