
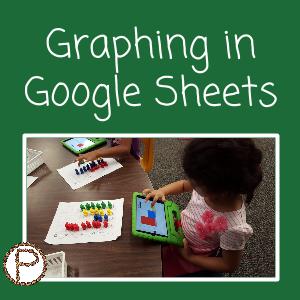
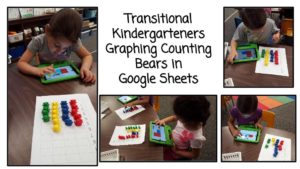
Little kids CAN use spreadsheets. My transitional kindergarten students blew my mind when they made bar graphs to represent the totals of their counting bears in Google Sheets.
 Alice Keeler, THE spreadsheet queen and EdTech specialist, and I brainstormed about ways littles could use spreadsheets. Alice formatted a spreadsheet template that was appropriate for my students to use. Her templates are INCREDIBLE. Check out Alice’s blog post “Exploring Graphing with Kindergarten using Google Sheets” for a template that has FOUR different sheets with various graphing options for you to choose from for your students. She also discusses how the sheet templates can be used.
I took one of Alice’s four sheets and used it with my students. I made three duplicates of the sheet within the same spreadsheet. I titled the copies “trial 1, trial 2, trial 3.” The trials could be used for students who finished early, so I could give them a new group of bears to graph. I also kept in mind that students may make mistakes and, depending on the situation, figured it would be easier for them to start fresh on another sheet instead of deleting their errors.
Click here for the Graphing Bears template
Insight on this Activity
Since iPads were the primary device my students had access to, they completed this activity on the iPads. It definitely worked for my students on the iPads, however if you have the option of using a Chromebook or desktop, consider one of those devices instead.
- Print out a copy of the table and have students graph the counting bears in the paper table BEFORE transferring the information into the spreadsheet. Click here for the template.
- Students tap/click in a cell and type a letter or number. When they move into another cell, the previous cell will automatically change colors (see GIF above).
- On the iPads, the keyboard took up space on the screen which made it difficult for some students to see what they were doing in the graph. Another option is for students to tap on the paint bucket and select a color (make sure it is the fill color and not the text color).
- If using desktops or Chromebooks, students type a number or letter and can go to the cell above it by pushing on the up arrow on the keyboard, or by clicking on the cell.
- Students will start to learn tricks, such as selecting multiple cells to add the fill color!